Measuring performance of the California public school system is a complicated business. We explain.
How does your local school measure up? Jengod CC-BY-SA-4.0
California spends an enormous amount of money every year , about 52% to 55% of its General Fund, on public K-12 and community college education. Its public education system is a vast and complex web of relationships between the state’s Department of Education, the County Offices of Education, as well as local school districts and schools. The state ensures that districts and schools are fiscally sound, and works to guarantee that local control over how children are taught is assured.
Given the slice of the general fund budget commanded by public education, it's understandable (and desirable) that the state also attempts to measure how well its 58 County Offices of Education, 1,019 school districts, 9,997 public schools and 300,000 teachers are delivering the education it's payng for, and how well its 5,837,690 students are educated.
But measuring performance across that lot is complicated.
Standardized Testing
Measurement of the educational performance of a County Office of Education, school district or school begins with testing students.
In 1999, California passed the Public Schools Accountability Act, which led to the development of the Standardized Testing and Reporting (STAR) system, to measure elementary school performance, at the same time creating the California High School Exit Exam (CAHSEE). In January 2014, those testing systems were replaced by the current California Assessment of Student Performance and Progress (CAASPP) System.
Under CAASPP, tudents are tested according to the following schedule:
The basic logic of standardized testing is to be able to measure performance, over time, of students in a given school, as well as to compare performance of students in different schools.
Other Data
In addition to the standardized test results, other important data is collected. This includes school absenteeism, the number of English as a Second Language (ESL) students, the number of students from disadvantaged socioeconomic backgrounds, the number of students in the foster care system, the number of fully credentialed teachers, and so on.
The California School Dashboard
At the end of 2018, the California Department of Education began publishing and updating a visual tool to represent its collected data and provide communities a means of understanding how well their schools were performing.
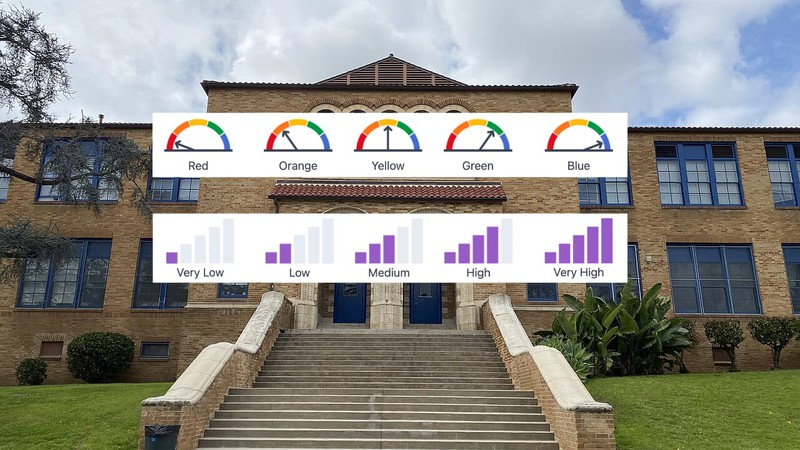
Using bar-graph and “speed-gauge" graphics, the California School Dashboard provides an overview of performance across a number of broad categories:
School Accountability Report Cards
While the visual dashboard provides a useful overview of the performance of a school, the annual School Accountability Report Card provides a more complete picture.
The report card begins with a description and mission statement for each school, followed by the number of enrolled students by grade and an overview of demographic information.
Demographic information includes percentage breakdowns of gender and race, the numbers of English learners, and of students from disadvantaged socioeconomic situations. It also talliesCK homeless, migrant and disabled students.
The report card next details three successive years of teacher placement and preparation data, which includes total number of teachers, and the percentage of teachers who are fully credentialed, not fully credentialed or teaching “out of field.”
The report card also scores the quality and currency of textbooks and instructional materials, and the conditions and planned improvements of school facilities.
Details about student performance, engagement, absenteeism, dropout rate and suspensions, according to the CAASPP system, are reported in aggregate and broken down as percentages by demographic category.
Information about class sizes, the number of non-teacher support staff—such as counselors— and teacher salaries help fill out the understanding of how well the school is providing an environment for student success. And just as important is the section outlining the school safety plan.
Keeping Parents and Communities Informed
The California School Dashboard and School Accountability Report Cards provide important information for parents and communities to understand how well their local schools and students are performing.
And while parents and policymakers may argue and be concerned about how well California’s public education may be working, it remains a wonder that such a vast and complicated system works at all.

 Subscribe
